
Sensor Testing Secrets
PART 2 OF 2
Welcome back to Part 2 of Sensor Testing Secrets. We trust you were able to use some of the tips to better diagnose vehicle electrical issues with temperature and position sensors. Miss Part 1? See the article here.
Testing an Exhaust Oxygen Sensor Circuit
After our first installment, you may be exhausted from all that testing. If so, what better way to start out than by testing some conventional Zirconia Oxygen Sensors. These sensors were first installed on vehicles in the 1970s and are still commonly used as post-catalytic converter oxygen sensors. They produce electricity in response to the difference in oxygen levels between the exhaust stream and the outside air. Think of them as little batteries and the oxygen ions in the air as the electrolyte. They typically produce between 100 millivolts and 900 millivolts (0.1 Volts to 0.9 Volts). The circuit and ECM/PCM that they are connected to will handle more than double that without damage. There are established tests for oxygen sensor response time but what do you do if there is little or no output seen from the oxygen sensor on your scan tool? How do you tell if the ECM/PCM is the problem? What about the wiring? What if you found a substitute source of voltage that you could introduce to the circuit (with the sensor unplugged) that would verify the wiring and the computer at the same time?
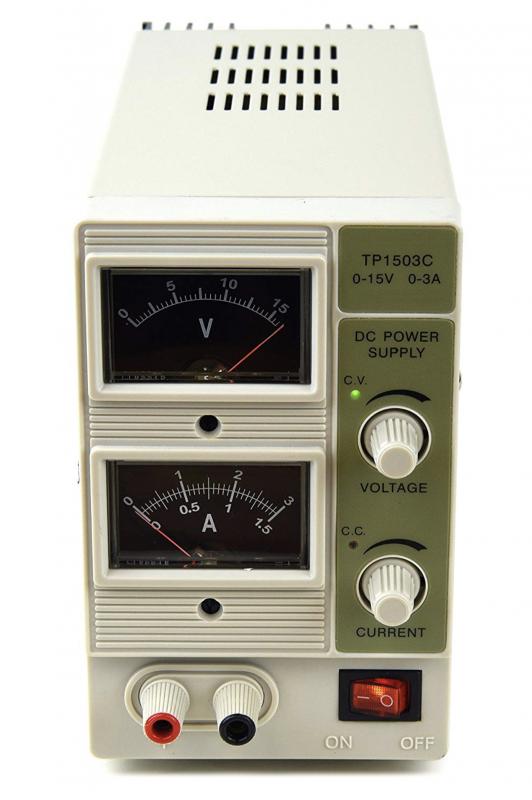
Here’s a source of voltage that would do the job. Solid, stable, variable between 0-15 Volts and reasonably priced. A compact DC power supply that converts your shop 120 VAC into 0-15 VDC.
What if that isn’t priced reasonably enough? What if that isn’t portable enough? How about using those AA batteries you just pulled from your pocket flashlight because the light was dim? 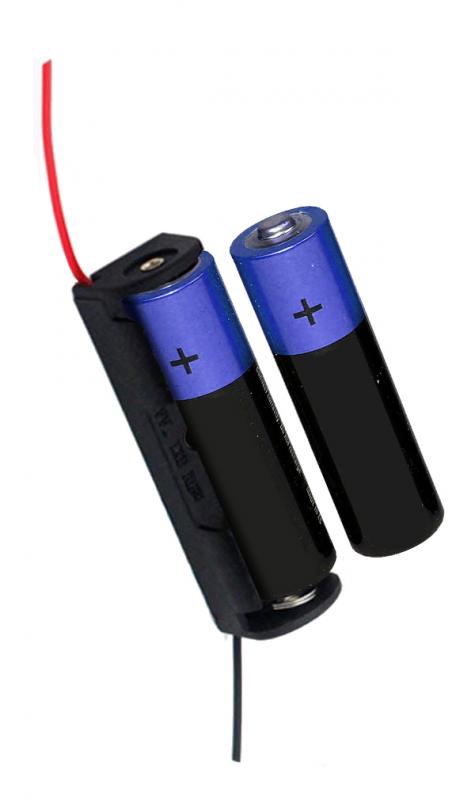 They are a source of stable DC voltage that can be used in place of the O2 sensor to check the integrity of the wiring and the computer. If the voltage you see on the scan tool is within a few millivolts of what your DVOM measured the battery at you now know the wiring and computer are good. The only cause remaining for a no or low output condition is the sensor itself. Note: a new AA battery has approximately 1.6 Volts. In theory it will work fine for testing the O2 sensor circuit, however we recommend that you use a somewhat depleted AA battery that has dropped to below 1.2 Volts. The AA battery holder depicted may be purchased online and will make the process of testing easier.
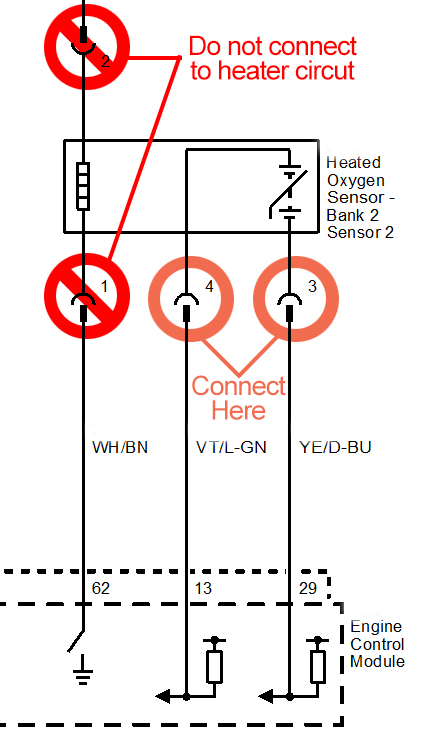 Connecting the battery will require that you identify the two sensor wires. Two of the wires on a 4-wire conventional heated zirconia O2 sensor are for the heated circuit. They will show battery voltage on a DVOM within a few seconds after engine start. You will want to connect to the harness side of the other two wires. NOTE: Avoid damage to the terminals on the harness connector while probing. You may have to try reversing the polarity of the AA battery connection to get a reading. If the scan tool On-board Diagnostics Parameter IDentification (PID) data for the O2 sensor being tested agrees with the voltage at the AA battery you can be confident that the wiring and the computer are working properly. Still no reading? Move that AA battery to the computer end of the harness. If you now have a reading check the wiring harness from the computer to the sensor. If there is still no PID reading, the computer is the culprit. Try this low-stress way of testing O2 sensor circuits on a known good car first to get the feel of it. We think you’ll find it effective.
Testing Pressure Sensors
Let’s start with two common pressure sensors, the Manifold Absolute Pressure (MAP) sensor and the Barometric Pressure (BARO) sensor. Both typically use a reference voltage (REF), a ground, and a signal wire. The signal wire voltage will typically vary between 1 and 4 volts if the reference voltage is 5 Volts. Not all reference voltage signals are 5 Volts, but most are.
Before getting in too deep there is a simple test that can verify the operation of MAP and BARO circuits. It involves using your scan tool to check the PID data for the two sensors.
| Altitude | Pressure | |||
| Zero Feet | Zero Meters | 28.1-31 in. Hg | 95.2-105 kPa | 14.0-15.1 PSI |
| 1000' | 305m | 27.1-30 in. Hg | 92-101.6 kPa | 13.6-14.8 PSI |
| 3000' | 914m | 25.1-28 in. Hg | 85-94.8 kPa | 12.6-13.8 PSI |
| 5000' | 1524m | 23.1-26 in. Hg | 78-88 kPa | 11.6-12.8 PSI |
| 7000' | 2134m | 21.1-24 in. Hg | 71-81 kPa | 10.7-11.9 PSI |
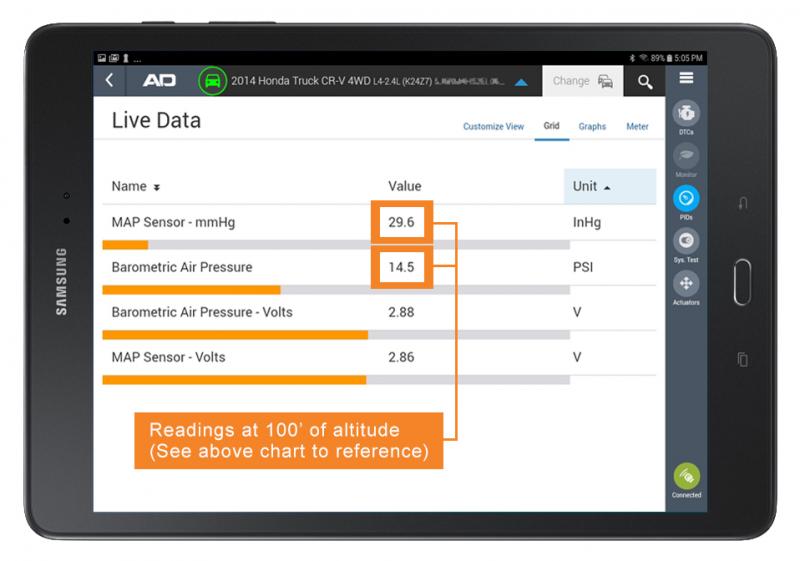
First, with the Key ON Engine OFF (KOEO) look at the two PIDs. The PIDs may be expressed as one of the following: PSI, inches of mercury (inHg), or kilopascals (kPa). They should agree with each other and they should agree with the ambient air pressure at your location. The ambient air pressure will vary somewhat from day to day depending on the weather, but the constant is your altitude above sea level. Google will tell you your altitude or you can call the administration of a nearby airport. This knowledge will lead you to the pressure reading you should see on the MAP and BARO sensors KOEO.
This simple test of the MAP and BARO will quickly tell you if these sensors, their circuitry, and the ECM/PCM can be trusted to give you proper manifold and atmospheric pressure information.
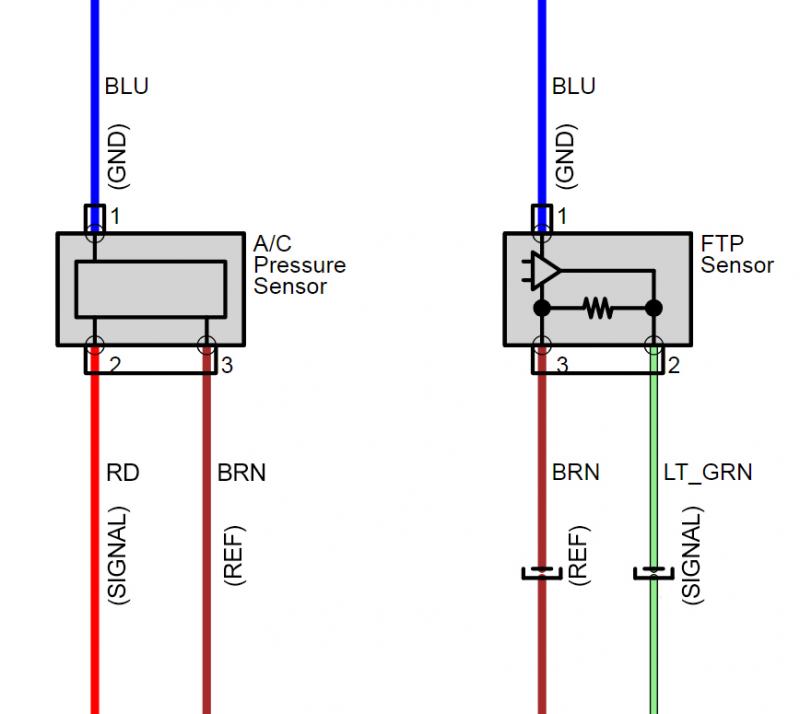 Other pressure sensor circuits may be tested by looking at PID voltage values while using jumper wires on the circuit. In this example of an actual A/C Pressure Sensor and Fuel Tank Pressure (FTP) Sensor circuit, the two sensors share a ground circuit via the BLUE wires, and a 5 Volt Reference on the BROWN wires. The variable voltage signals back to the ECM/PCM are carried on the RED wire for the A/C Pressure Sensor and the LIGHT GREEN wire for the FTP Sensor. Because they share a ground and a reference voltage, a problem in either ground or reference will affect both sensors.
To test the integrity of the circuits, carefully jump the BROWN Reference wire at the sensor you’re testing to the signal wire (RED for the A/C Pressure Sensor, LIGHT GREEN for the FTP Sensor) for that sensor. The Voltage PID for that sensor should read 5.0 Volts ±0.1 volt. With that jumper still installed, add a second jumper between the signal wire and the ground circuit (BLUE) wire. The PID for the sensor being tested should drop to zero Volts. These readings indicate a healthy circuit and a healthy ECM/PCM. Any other readings are cause for further investigation of the wiring, ECM/PCM, and any intermediate connections.
This test can be used on any pressure sensor circuit that has a reference voltage, ground, and signal wire.
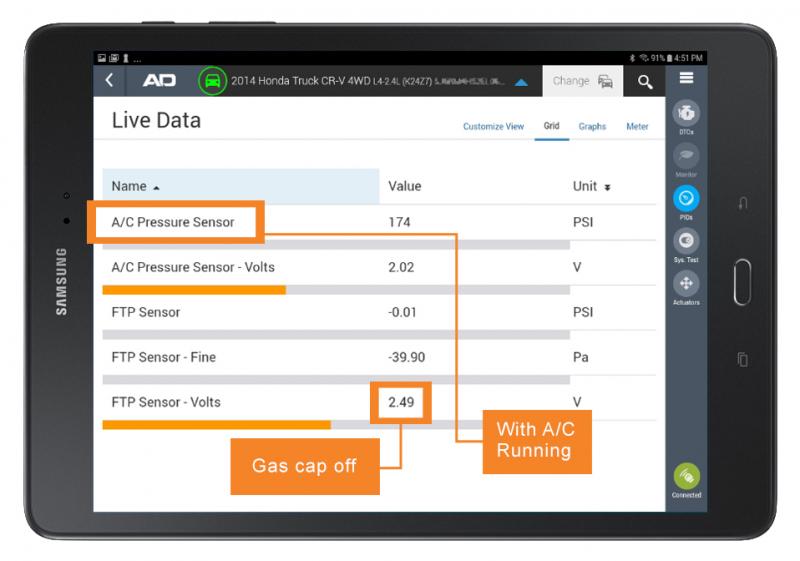
The A/C pressure sensor accuracy can be tested by comparing the pressure PID to the readings on your air conditioning service gauges. The sensor is usually located on the high-pressure side of the system. The readings should be within 10% of each other.
The FTP sensor accuracy can be verified by removing the gas cap and opening the tank to atmospheric pressure. The FTP sensor PID voltage should indicate as per this chart (give or take 0.2 Volts).
| Manufacturer | FTP PID Voltage |
| Acura/Honda, Ford, Hyundai/KIA, Subaru | 2.5 V |
| Mazda | 2.6 V |
| Nissan/Infiniti | 3.3, 3.8, 4.2 V |
| Toyota/Lexus/Scion | 3.3 V |
| General Motors | 1.5 V |
These tips will give you a head start on diagnosing pressure sensor circuits. Try them out on known-good cars first if possible. The more you use these tips the faster and more accurate you will be.
Testing Airflow Sensors
Testing a Mass Airflow (MAF) sensor circuit involves testing for power and ground at the sensor. You’ll need to apply what you have learned about circuits to analyze the MAF wiring and determine if it uses a battery voltage reference or a reduced reference voltage such as 5 Volts. Your primary testing tool will be a DVOM.
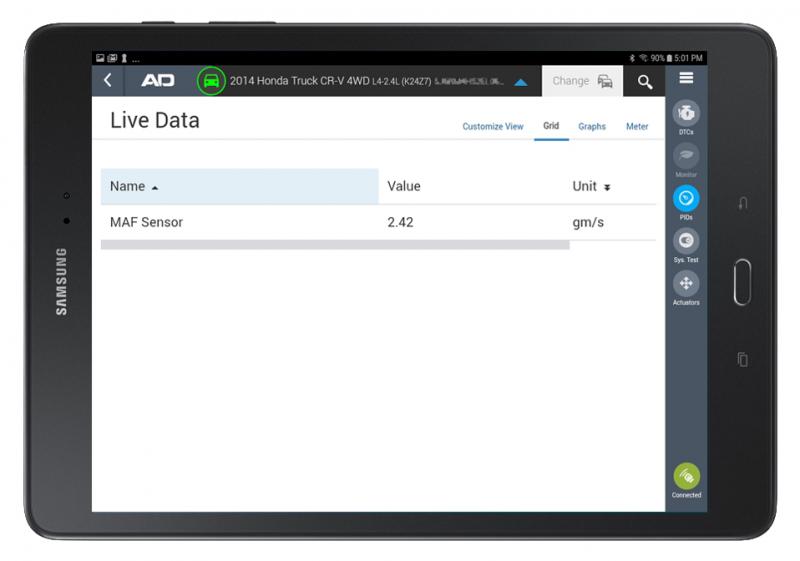
There is a quick test you can do with your scan tool to verify the sensor, the circuit, and the ECM/PCM. It may even help you identify vacuum leaks or loose air ducting between the MAF sensor and the throttle body (unmetered air flow).
Here’s how it works: since the engine is an air pump, there is a relationship between engine displacement and airflow measured by the MAF. Set up your scan tool to measure MAF airflow in Metric system measurement. Determine the engine size in Liters. At an idle speed between 500 and 600 RPM the MAF PID in grams per second (g/sec) should be 1 gram per second per liter of engine displacement in Neutral or Park. A 3.0L engine should produce MAF data showing approximately 3.0 g/sec at 500 RPM. At 1200 RPM the reading should double. This test is more accurate on naturally aspirated engines but will work reasonably well with a turbo charged engine. If the results are higher than normal a rich running condition may result. If your results are lower than normal you may have vacuum leaks, PCV problems, or loose connections on inlet tubing between the MAF and the throttle body.
Speed Sensor Testing
Speed sensors come in two popular flavors. The first type is the Variable Reluctance Sensor (VRS) that generates an analog alternating current (AC) sine-wave signal that increases in voltage and frequency with speed. The second type is the Hall-Effect sensor that generates a digital square-wave signal that only increases in frequency with increase in speed; the voltage output remains the same. There are other speed sensor types out there but the VRS and Hall-Effect are the most common. You’ll find speed sensors used in Engine/Transmission Management, Anti-Lock Brakes/Vehicle Stability Control, Power Sliding Doors…anywhere we need to know speed.
The scan tool is your primary method of testing any speed sensor. If you’re not seeing data, you’ll need to analyze the circuit to determine if the wiring and the module affected are healthy. Don’t overlook sensor mounting – they need to be near whatever rotating part is being measured. Rust, corrosion, and loose fasteners can increase air gaps.
In a future article we will expand on speed sensor testing and we will introduce another powerful tool you should consider adding to your collection, the Digital Storage Oscilloscope.
Practice the testing procedures you’ve learned, and you will find your efficiency and your “fixed right – first time” results climbing to new levels of excellence.
Want to see how ALLDATA can improve shop efficiency? Check out our suite of products, each designed to contribute to both shop efficiency and productivity.
If you would like to read more articles like this one please subscribe to ALLDATA News.
