KPI Dashboard
The Key performance indicator (KPI) Dashboard provides a snapshot on how the shop is doing for the given date range and contains links to export a variety of full shop reports. The Dashboard can be customized to display Metrics that are the most Relevant to your shop.
KPI Dashboard Settings
KPI Dashboard Settings
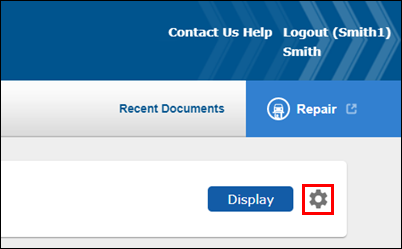
- Click settings (gear icon) at the right of the date selection section.
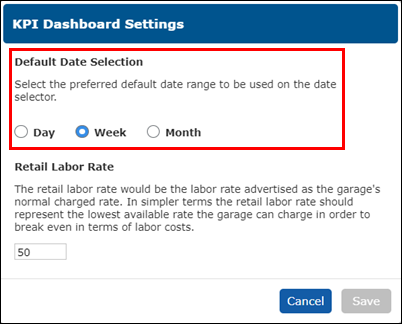
- Choose a Default Date Selection range to appear when the page initially loads.
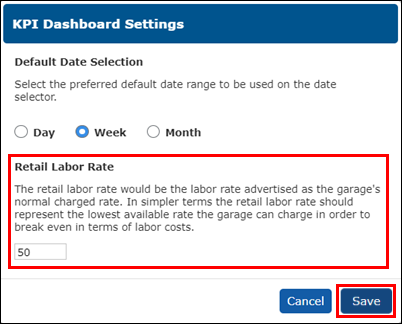
Enter a Retail Labor Rate >> click Save.
- Note: The Retail Labor Rate is used to calculate Retail Recovery Rate KPI and should be entered as the lowest available rate that the shop can charge and still break even.
Configure KPI Dashboard
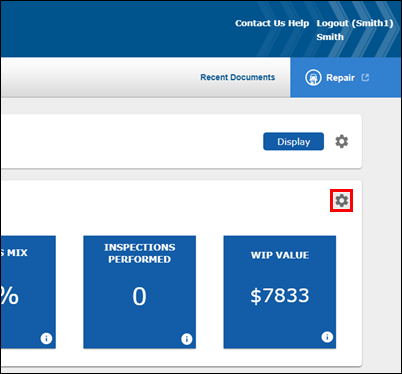
- Click configure (gear icon) at the right of the Key Performance Indicators section.
- Remove any unwanted KPIs from the dashboard by selecting them from the Selected KPIs menu on the right and clicking the left arrow.
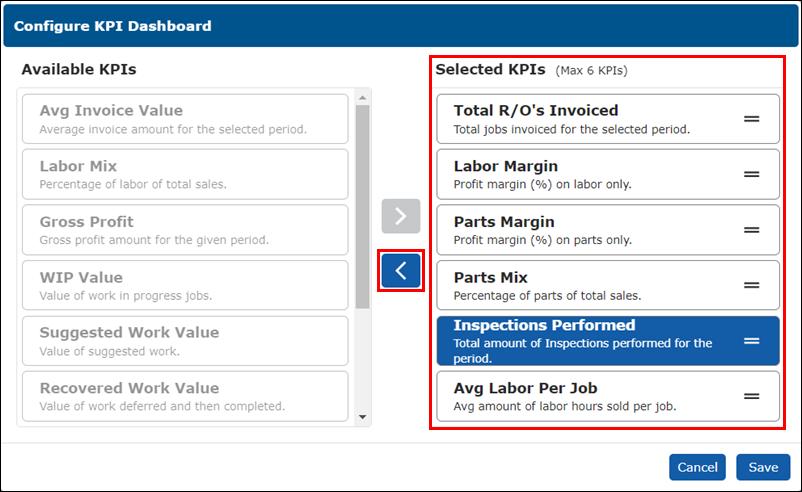
- Add KPIs to the dashboard by selecting them from the Available KPIs menu on the left and clicking the right arrow.
Notes:
- You will be unable to add more Available KPIs without first removing Selected KPIs if you already have the maximum of 6 KPIs added.
- Left-click and hold to reorder the KPI order.
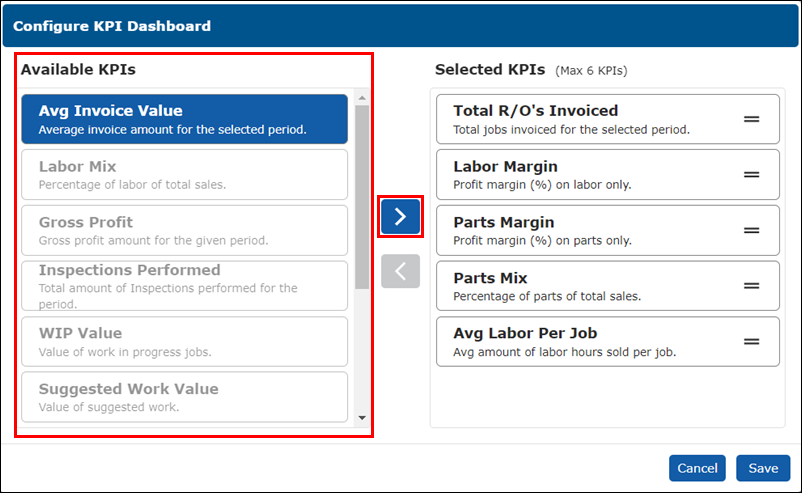
- Click Save when done.
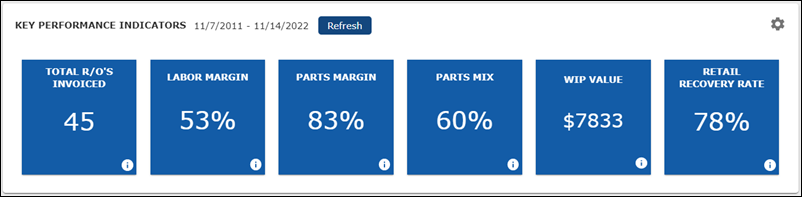
Viewing the KPI Dashboard
- The KPI Dashboard and reports will automatically display data based on the defaults set in the configuration and settings.
To show data from a different period of time, select a display period >> click the date or calendar button to choose a date range >> click Display.
- Day - Display a single day's worth of data. Navigate to different months using the forwards and backwards arrows and adjust the years by clicking the currently selected year at the top left of the date selector.
- Week - Display a week’s worth of data. Choose a day to highlight that entire week starting from Monday. Navigate to different months using the forwards and backwards arrows and adjust the years by clicking the currently selected year at the top left of the date selector.
- Month - Display a month’s worth of data. Select one of the 12 months of the year from the popup. Adjust the year by clicking on the currently selected year at the top left corner.
- Year - Display a year’s worth of data. Select one of the years from the popup.
- Range - Select a custom start and end date.

The KPI tiles will update to include data for the newly selected date range.
- Hover your mouse over an information icon (i) to view a description of the KPI.
Report Quick Links
Use these reports to manage your shop more effectively.
- Select a display period >> click the date or calendar button to choose a date range >> click Display.
- Select one of the following reports:
Sales and Margin Reports
Customer Turnover
Displays every customer within a selected date range, showing the amount of Invoices, Average Cost, Total Value, Profit and Margin percentage of each customer.
- The Customer Turnover Report is displayed.
- Modify the displayed report by choosing the following options then clicking Refresh:
- Select a Customer Type to display data for a specific customer type.
- Click the Summarized checkbox to view totals only.
- Click Print to print the report, or click Export to CSV to save a copy of the report that can be read using Excel.
Invoice Item Margin Report
View margins associated with each invoice within a selected date range. Includes cost and sales tax.
- The Invoice Item Margin Report is displayed.
- Enter a part and click Refresh to filter the results.
- Click Print to print the report, or click Export to CSV to save a copy of the report that can be read using Excel.
Profit Tracker
Breaks down each invoice within a selected date range, to a dollar amount of Cost price, Sell price, Margin amount and Margin percentage.
- Results are displayed.
- Modify the displayed report by choosing the following options then clicking Refresh:
- Enter or search for a Customer ID
- Select a Customer Type to display data for the specified Company Type.
- Select the Summarized check box to view totals only.
- Click the magnifying glass next to the Invoice and R/O number to view and print those documents.
- Click Print to print the report.
Sales by Job Category
Displays each Job Category and the amount of invoices/credits and repair orders associated with the each category. Shows the Labor, Parts, Misc, Net and Gross Total from each Service Writer.
- The Sales by Job Category Report is displayed.
- Modify the displayed report by choosing the following options then clicking Refresh:
- Select a Category to display data for a specific category.
- Click the Summarized checkbox to view totals.
- Click Print to print the report, or click Export to CSV to save a copy of the report that can be read using Excel.
Sales by Service Writer
Displays each Service Writer and the amount of invoices/credits and repair orders associated with the each writer. Shows the Labor, Parts, Misc, Net and Gross Total from each Service Writer.
- The Sales by Service Writer Report is displayed.
- Modify the displayed report by choosing the following options then clicking Refresh:
- Select a Service Writer to display data for a specific service writer.
- Click the Summarized checkbox to view totals.
- Click Print to print the report, or click Export to CSV to save a copy of the report that can be read using Excel.
Turnover By Customer Type
Displays turnover for each customer pay type. Display up to four years per each selectable date range.
- Select a Month to start from >> click Display.
- Select a number of Years (1 to 4) to view >> Chart Type >> select Parts to display parts totals only, or Parts and Tax to display parts and tax totals only.
- A chart is displayed.
- Click Print to print the chart, or click Export to CSV to save a copy that can be read using Excel.
Turnover Top Ten Customers
Select a date range to graphically display your Top Ten Customers and their expenditures at your shop on a variety of chart type graphs.
- Select a Month to start from >> click Display.
- Select a number of Years (1 to 4) to view >> Chart Type >> select Parts to display parts totals only, or Parts and Tax to display parts and tax totals only.
- A chart is displayed.
- Click Print to print the chart, or click Export to CSV to save a copy that can be read using Excel.
Yearly Profit
Displays up to four years of profit, by month, on a variety of chart type graphs.
- Select a Month to start from >> click Display.
- Select a number of Years (1 to 4) to view >> Chart Type.
- A chart is displayed.
- Click Print to print the chart, or click Export to CSV to save a copy that can be read using Excel.
Yearly Turnover
Displays Yearly Turnover of Parts or Parts and Tax. Select a date range in four year intervals, and select from various chart types to view turnover.
- Select a Month to start from >> click Display.
- Select a number of Years (1 to 4) to view >> Chart Type >> select Parts to display parts totals only, or Parts and Tax to display parts and tax totals only.
- A chart is displayed.
- Click Print to print the chart, or click Export to CSV to save a copy that can be read using Excel.
Analysis Reports
Business Analysis
From a selected date range, shows totals and averages of Parts, Labor, Inspection, Consumables, and Miscellaneous items.
Totals and Averages are displayed.
- Click Print to print the list of results, or click Export to CSV to save a copy of the report that can be read using Excel.
- When clicking Export to CSV, you may also select to Export Summary or Export Totals.
Custom Job Analysis
Displays each Custom Job used and the amount of invoices associated with the each job. Shows the financial impact on the shop of each custom job.
- The Custom Job Analysis Report is displayed.
- Modify the displayed report by choosing the following options then clicking Refresh:
- Select a Price Type to display data for a specific price type.
- Click the Summarized checkbox to view totals.
- Click Print to print the report, or click Export to CSV to save a copy of the report that can be read using Excel.
Inspection Analysis
Displays inspections by Labor Code, Customer Type and Inspector from a selected date range.
- The Inspection Analysis Report is displayed.
- Select a Labor Code, Cust Type or Inspector >> click Refresh to better filter results.
- Click Print to print the report, or click Export to CSV to save a copy of the report that can be read using Excel.
Labor Analysis
Displays labor codes, and the amount of invoices utilizing each code. Cost and sell price, and profit by labor code is also displayed.
- The Labor Analysis Report is displayed.
- Modify the displayed report by choosing the following options then clicking Refresh:
- Select a Technician to display data for a specific technician.
- Click the Summarized checkbox to view totals.
- Click Print to print the report, or click Export to CSV to save a copy of the report that can be read using Excel.
Media Analysis
Displays each Media Code and the amount of invoices associated with the each code. Shows the financial impact on the shop of each medium.
- The Media Analysis Report is displayed.
- Modify the displayed report by choosing the following options then clicking Refresh:
- Select a Media Code to display data for a specific media code.
- Click the Summarized checkbox to view totals.
- Click Print to print the report, or click Export to CSV to save a copy of the report that can be read using Excel.
Parts Analysis
Lists each part sold within a date range showing the Profit and Margin on each part.
- The Parts Profit Report is displayed.
- Modify the displayed report by choosing the following options then clicking Refresh:
- Select a Product Group to display data for a specific product group.
- Click the Include shop supplies PG checkbox to also include data from the shop supplies product group.
- Choose to display All parts, Stocked Parts or Non-Stocked Parts
- Click Print to print the report, or click Export to CSV to save a copy of the report that can be read using Excel.
Recovered Work Analysis
Displays each Job Category and Deferred Reason. This includes the amount of invoices/credits and repair orders associated with the each category as well as Net and Gross Total.
- The Value of Recovered Work Report is displayed.
- Select a Category, Deferred Reason, or who the invoice was deferred by >> click Refresh to better filter results.
- Click Print to print the report, or click Export to CSV to save a copy of the report that can be read using Excel.
Suggested Work Analysis
Displays each Job Category and Source of the Suggestion. This includes the amount of invoices/credits and repair orders associated with the each category as well as Net and Gross Total.
- The Value of Suggested Work Report is displayed.
- Select Source >> click Refresh to better filter results.
- Click Print to print the report, or click Export to CSV to save a copy of the report that can be read using Excel.
Miscellaneous Reports
Good Better Best
Displays a breakdown of Good Better Best Job selections by ticket and can be filtered by Job Category or by Service Writer.
- The Good Better Best Report is displayed.
- Select a Category, or who Service Writer >> click Refresh to better filter results.
- Click Print to print the report, or click Export to CSV to save a copy of the report that can be read using Excel.
- When clicking Export to CSV, you may also select to Export Summary or Export Totals.
Inspection Technicians
Lists each Inspection Technician, and the inspections each technician has completed.
- Technicians and Inspections are displayed.
- Check the Summarized check box and click Refresh to only see the total inspections for each technician.
Supplier Spend
Displays amount of money spent with suppliers over a selected date range.
- The Supplier Spend Report is displayed.
- Modify the displayed report by choosing the following options then clicking Refresh:
- Select a Supplier to display data for a specific supplier.
- Click the Summarized checkbox to view totals.
- Click Print to print the report, or click Export to CSV to save a copy of the report that can be read using Excel.
Technicians Work
Displays invoices and credits, showing the amount of Hours Sold, Value Sold, and Profit, by each technician.
- Technicians and totals are displayed.
- Modify the displayed report by choosing the following options then clicking Refresh:
- Choose to display Primary Technicians or QC Technicians.
- Choose display any of the following line types to display:
- Labor
- Inspection
- Parts
- Click the Summarized checkbox to view totals.
- Click Print to print the report, or click Export to CSV to save a copy of the report that can be read using Excel.
Vehicle Work (by License)
Displays invoices, cost amount and sell amount of labor and parts, and profit by vehicle license serviced in the shop over a selected date range.
- Vehicle Work (by License) Report is displayed.
- Modify the displayed report by choosing the following options then clicking Refresh:
- Enter a License to display data for a specific vehicle.
- Click the Summarized checkbox to view totals.
- Click Print to print the report, or click Export to CSV to save a copy of the report that can be read using Excel.
Vehicle Work (by Model)
Displays invoices, cost amount and sell amount of labor and parts, and profit by vehicle type serviced in the shop over a selected date range.
- Vehicle Work (by Model) Report is displayed.
- Modify the displayed report by choosing the following options then clicking Refresh:
- Enter a Make and Model to display data for a specific vehicle.
- Click the Summarized checkbox to view totals.
- Click Print to print the report, or click Export to CSV to save a copy of the report that can be read using Excel.
Work in Progress
Displays the date, cost amount and sell amount of labor and parts, totals, and margins by work documents that are not yet invoiced.
- Work In Progress Report will automatically display
- Modify the displayed report by choosing the following options then clicking Refresh:
- Enter a Status to display data for a specific status.
- Click the Summarized checkbox to view totals.
- Click Print to print the report, or click Export to CSV to save a copy of the report that can be read using Excel.